Many people have some idea of how an X-ray is made, but how an ultrasound image is created from sound is less well known. In this blog post, I will show how the most common technique to form an ultrasound image works. This technique is called Delay-And-Sum beamforming or DAS for short.
First, let’s look at what happens physically when making an echo and what we are actually measuring. To create an image with ultrasound, a transducer is used. This is a measuring instrument with a row of sensors that can transmit and receive sound waves. To form an image, a sound wave is first emitted. The sound wave moves through the tissue where it reflects on different structures. This reflection process is super complex, but fortunately there is a simple model for it:
You can think of the tissue as a space in which a large number of points are located that absorb a sound wave and then emit it in all directions.
These points are called scatterers (because they scatter the sound in all directions). This is only a model and cannot explain all aspects of ultrasound, but it is good enough for us now.
The reflections from the scatterers are captured by the elements of the transducer. The signals received by the elements are combined into an image that shows how strong the reflections are from each location in the image. This process of going from individual sound signals to an image is called beamforming.
Scenario 1 - One Sensor, One Scatterer
To understand the beamforming process, let’s first look at a highly simplified scenario: we have a transducer with only 1 sensor element and we scan an image with only 1 scatterer in it.
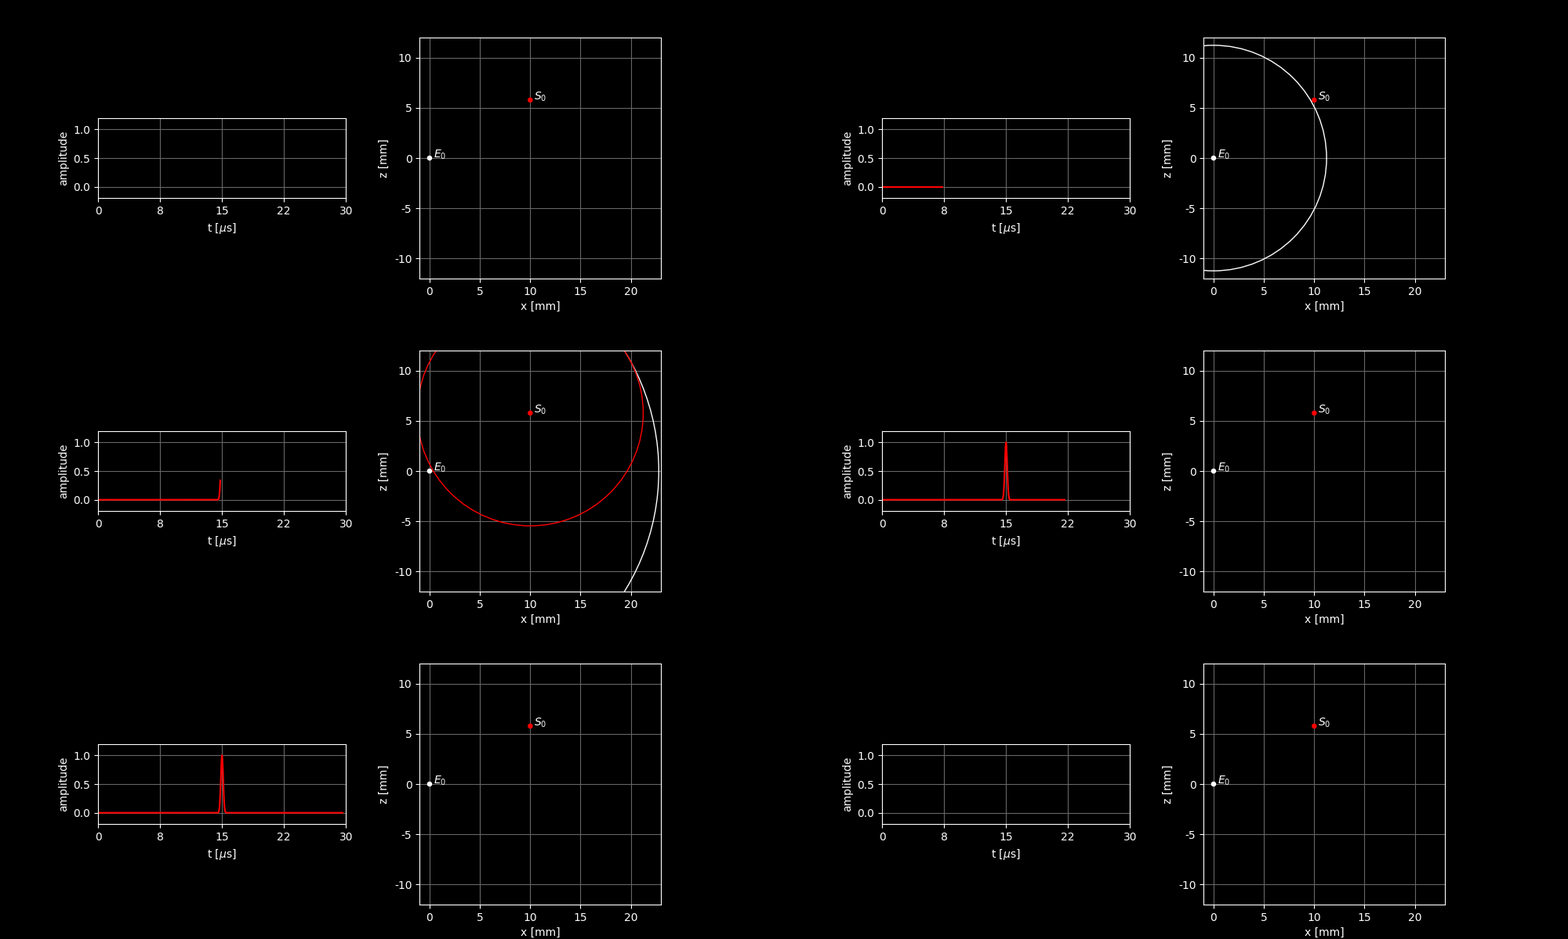
In the right image, you can see how the sound wave propagates from and is scattered by . In the left graph, you can see the sound signal received by . Two things can be inferred from the incoming signal:
- Because there is a peak in the signal, we know that there must be a scatterer present.
- Because we know how fast a sound wave moves, we can also deduce from the time between transmission and reception how far away the scatterer is located.
🧮 Calculation (click to expand)
The signal is sent at and the reflection is received at . The speed of sound in tissue is about . The total distance that the wave has traveled in that time is therefore This is the distance of the round trip. So, the scatterer is halfway, which means that the distance between the scatterer and the sensor is .
But we are not only interested in how far away the scatterer is. We want to know where it is. Unfortunately, we will never find out in this way. We can see this in this alternative scenario: if is located elsewhere but is still the same distance away from the sensor, we measure exactly the same signal! Again, the peak is exactly at .
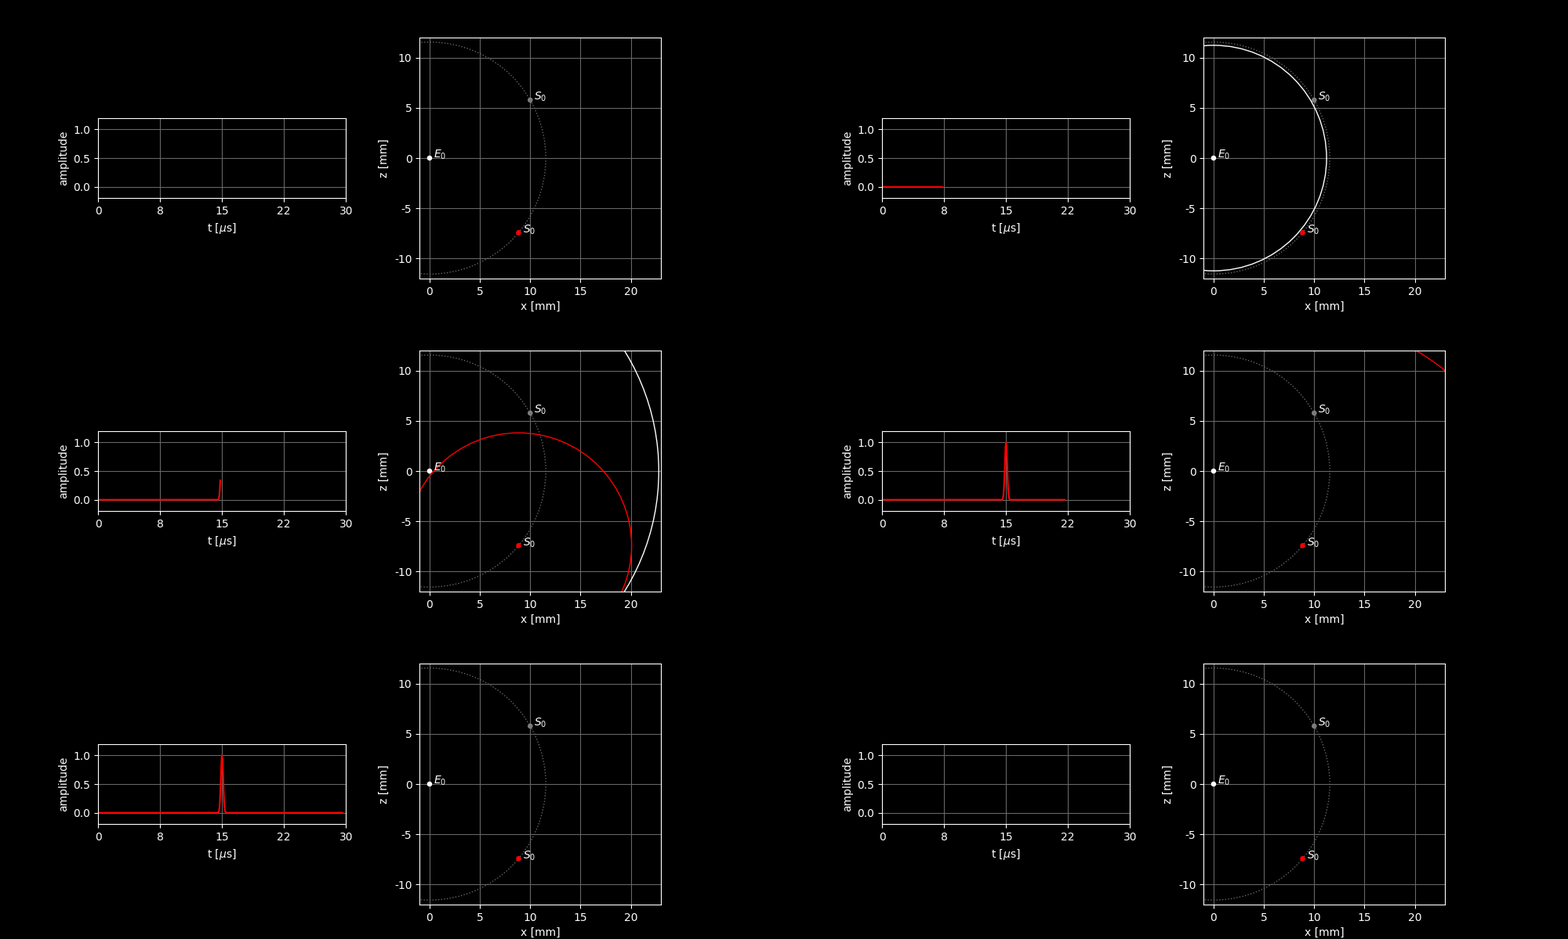
This means that the reflections of all scatterers that lie on a circle arrive simultaneously at . So, we cannot distinguish between the different scatterers. Here, you can also see that the measured peak is now much higher. The reflections of all scatterers add up here. (We’ll come back to that later.)
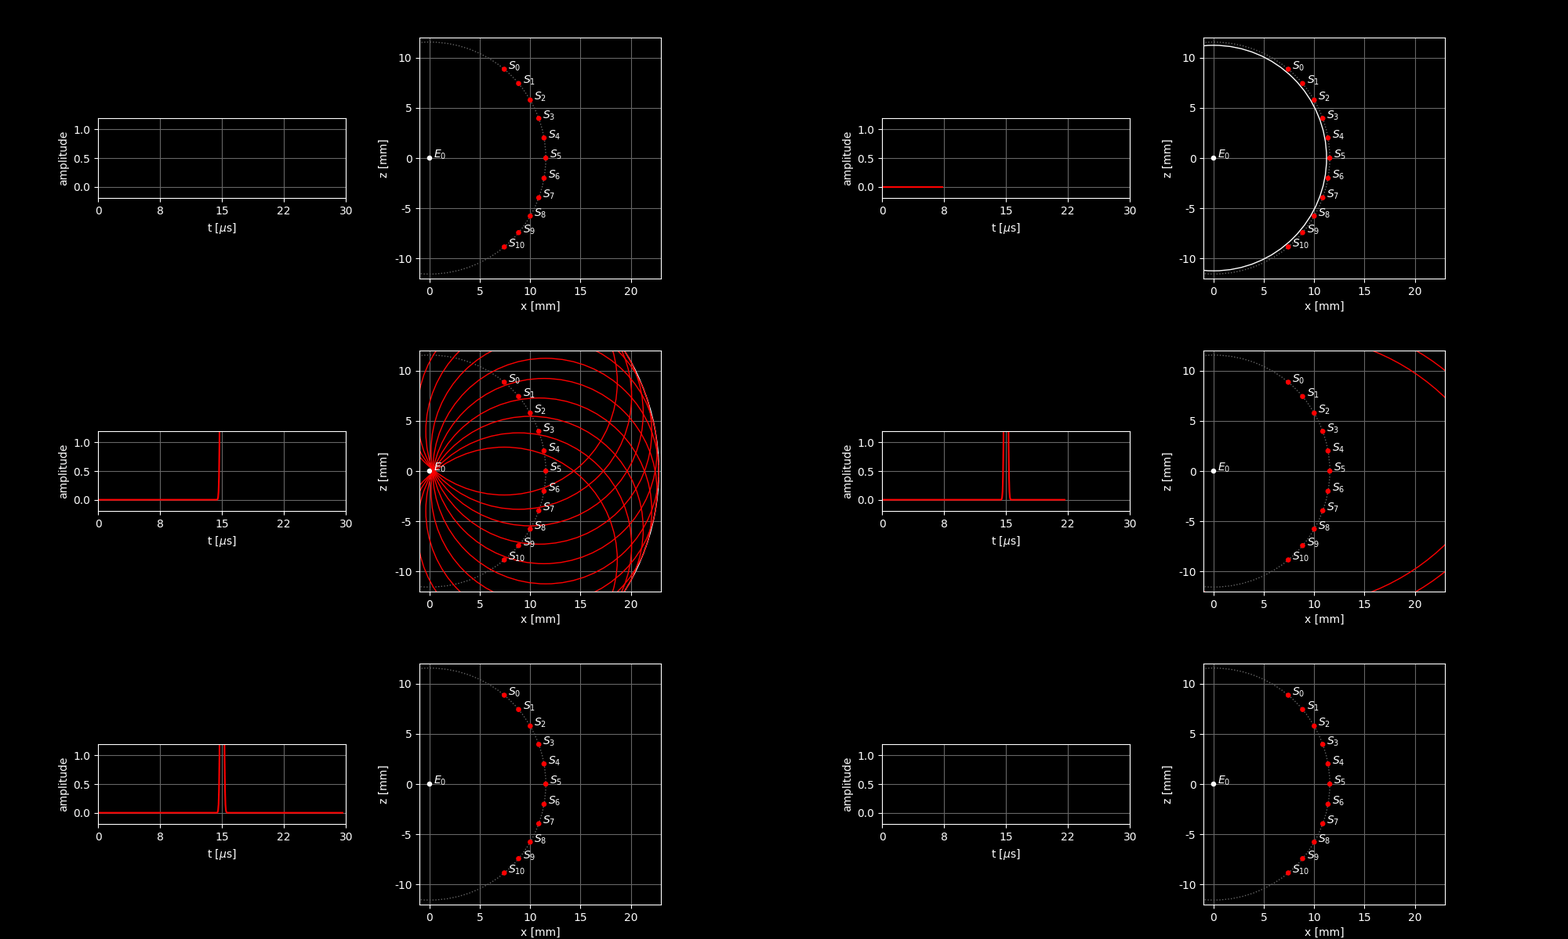
To enable us to determine where the scatterer is located, we need more information. We can get that information by adding extra sensors at other locations.
Scenario 2 - More Elements
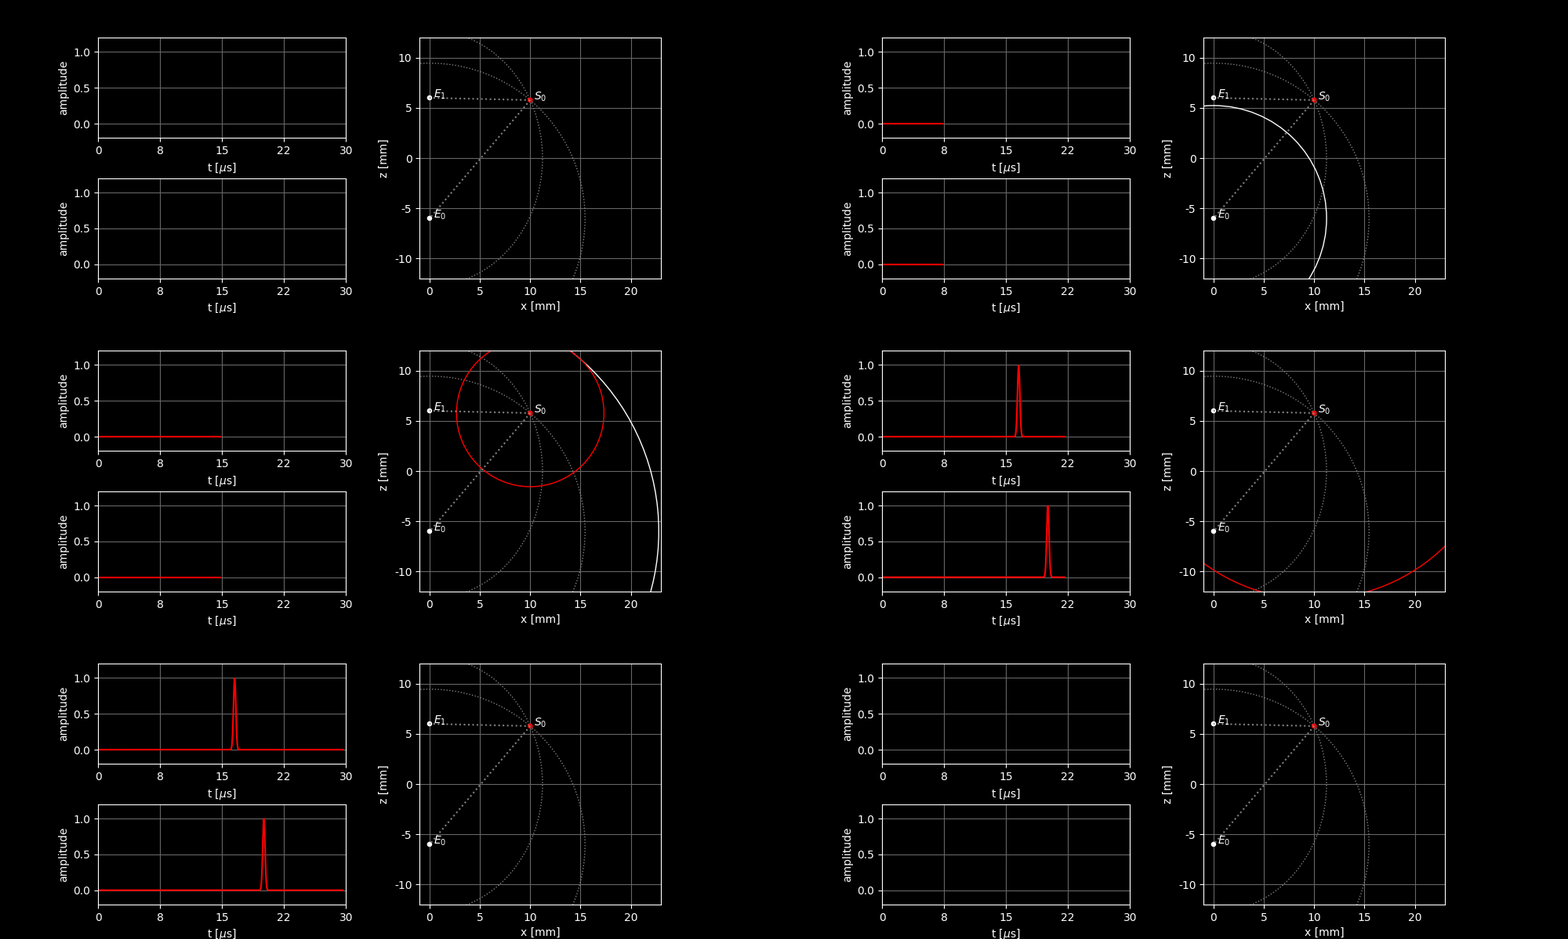
We now take two sensors instead of one. Again, element sends out a sound wave. The sensors pick up the same signal, but with different delays. Based on the delays, we can, just like before, calculate for element how far away the scatterer is located. We can now also find a ring with possible locations for . With both, we can find the exact location of the scatterer: At the intersection of the two rings. (Actually, it’s not a ring, but an ellipse. See the calculation block for an explanation.)
🧮 Calculation (click to expand)
For , we can calculate the distance as before: the time at which we receive the peak with sensor , , is the time from to and back. The total distance between and is therefore The round trip is of equal length, so all possible locations for the scatterer are those for which the distance to is equal to .
For , it’s different because the pulse is not sent from . This means that and no longer have to be equal. If the peak is received at time , we know that the sound has moved the distance from to in that time (i.e., ) and then the distance from to (i.e., ). The total distance is therefore The possible locations for the scatterer are therefore the locations for which this equation holds. If you solve this, you will find that the scatterer must be somewhere on an ellipse around and .
Delay-And-Sum Beamforming
We have now seen that with one sensor, we can determine how far away a scatterer is located and with two or more sensors, we can see where a scatterer is located. The problem is that in practice, we cannot assume that there is only one scatterer. That is literally never the case. In practice, there are many scatterers that are all “talking” at the same time. Let’s look at an example that is a little closer to reality: we take scatterers at random locations and more than two sensors:
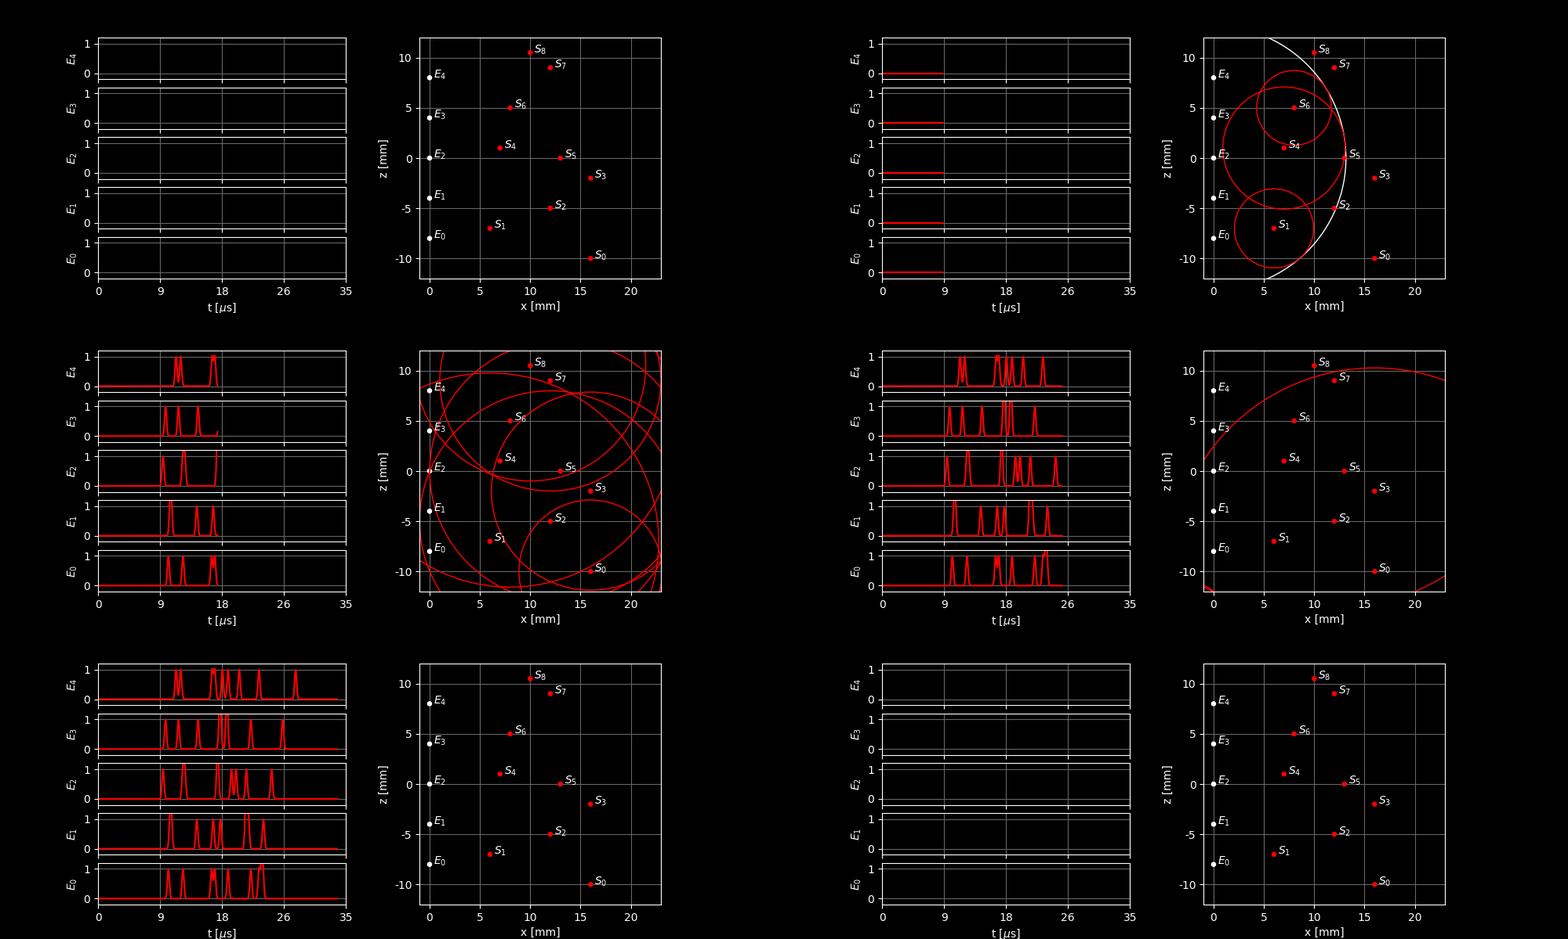
The signals now look much more chaotic, and without the right image, it is no longer clear which peak belongs to which scatterer. This means that we can no longer determine where the scatterers are located so easily.
To solve this problem, we use Delay-And-Sum beamforming. In this technique, we actually do the opposite of what we did before: instead of looking where the peak is in the signal and calculating the distance, we choose a distance to focus on and calculate the corresponding delay. By focussing on a specific time in the signal of sensor , we are focusing on the ellipse of all points from which reflections arrive at that time. The value we measure there is therefore the sum of all scatterers on that ellipse.
We now choose a focus point . We want to know how strong the reflections are from point . We can focus on point by looking at each sensor in the received signal for the moment when the reflections from arrive precisely at that sensor. (This is the delay part.) This way, we find for each sensor a value that tells us how strong the reflections from its ellipse are through . If we add up these values, we get an estimate of how strong the reflection from point is. (This is the sum part.)
🧮 Calculation (click to expand)
If we have chosen a focus point , we can find the corresponding delays and thus the locations in the received signals as follows. For each element , we can calculate the total distance that the wave had to travel from (the sender) to and then to . The total distance consists of a distance forward and a distance back . The delay that belongs to this is The calculated delays are shown in the figure below.
The image below shows what happens when you look at different locations in this way and add up all the signals. The dashed lines in the left graphs show which part of the received signal is used to focus on . The bar on the right shows how high the total response is. The contribution of the different sensors to the height of the bar is always separated by a line. To make it clearer which sensor receives a strong signal, the ellipse and a line to the corresponding element appear when the signal received by that element becomes stronger. In the background, you can see the image formed when you let move over all possible locations and assign the pixel a brightness based on the total response at that location.
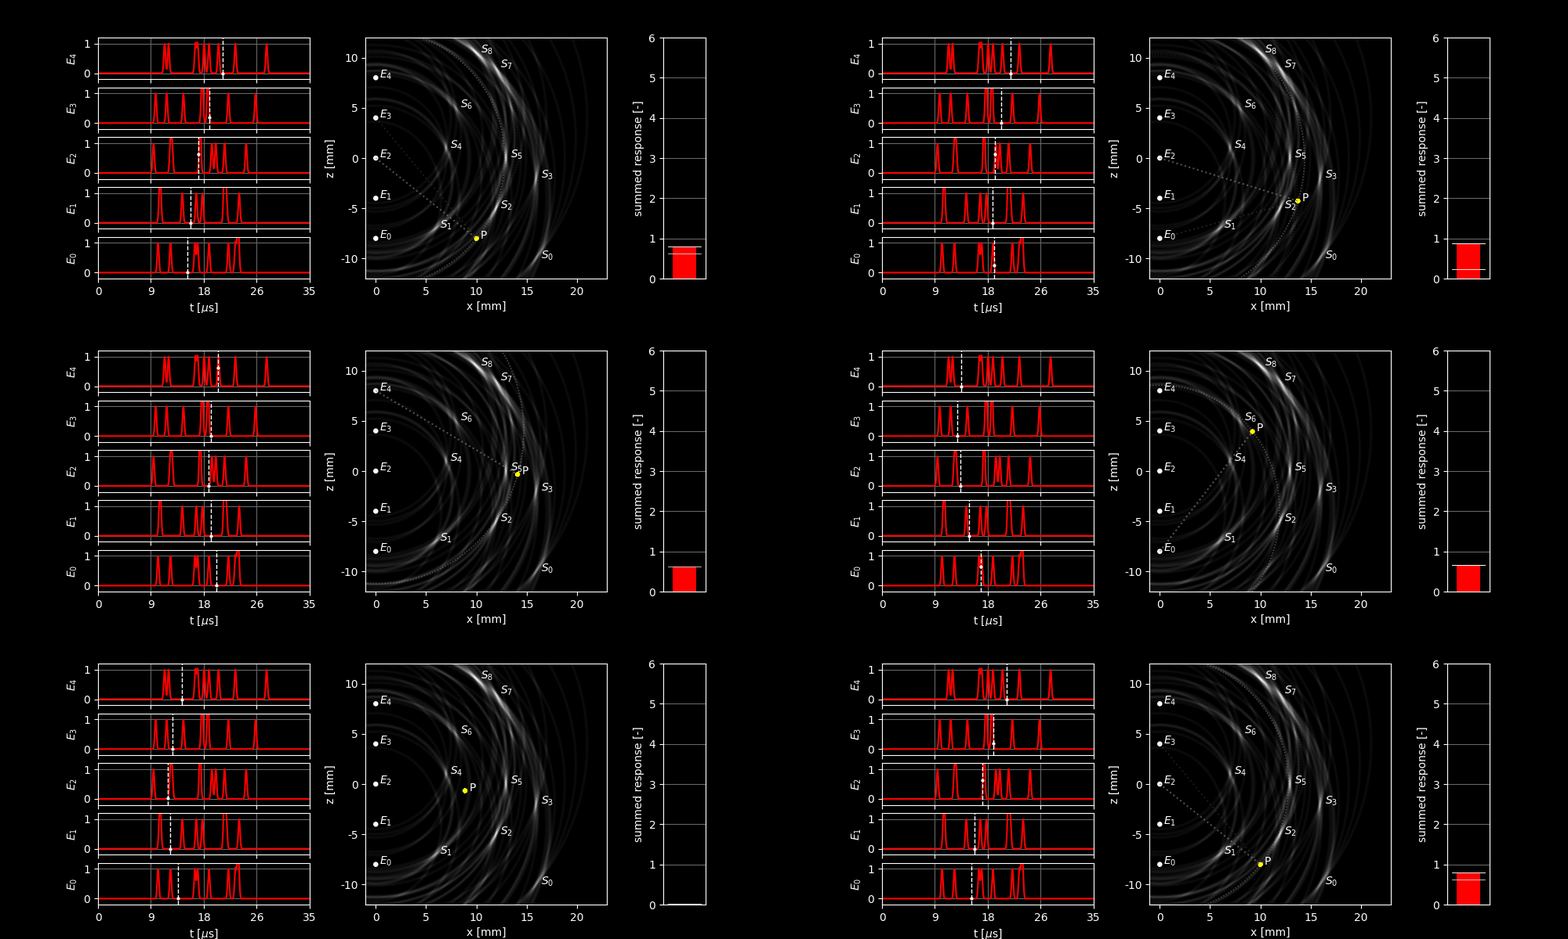
In this figure, we can see several things:
- We see that the response is by far the largest when we are actually focused on a scatterer and that the scatterers are recognizable in the image.
- However, we also see that the output is not always zero when we focus on a point where there is nothing. This is because the focus point then lies on the same ellipse as one or more of the scatterers.
- If the focus point moves away from a scatterer, we see that the summed response does not immediately drop to zero. This is because the pulse we sent out is not infinitely sharp but has a certain width. We first have to ‘walk down the mountain’ before we reach zero. This is a limit to how sharp the image can ultimately become.
- Scatterers and have a more smeared out dot in the image than, for example, . This is because and are located more to the side, causing the ellipses of the different elements to be more similar, which means their approximate overlap covers a larger region. The resolution of an ultrasound image is therefore not the same everywhere!
Although the quality of the image leaves a lot to be desired, it is clear that the principle works and provides us with a way to create an image from a series of seemingly chaotic signals.
Sidenote
Some may notice that the world is not 2-dimensional but 3-dimensional. This means that all points equidistant from a sensor form not a circle but a spherical surface. Does this still work? Well no! Sensor elements that lie on a line can distinguish between all locations in a plane in 2D, but not in 3D. To suppress reflections from outside the image plane, ultrasound transducers have an acoustic lens to focus the transmitted energy in the imaging plabe. Some transducers also have a grid of elements instead of a line. These same beamforming techniques are then used to focus on the desired plane and suppress signals from outside that plane.
Interesting links
- The paper So you think you can DAS provides a comprehensive but relatively accessible explanation of how to implement DAS-beamforming.