The generalized contrast-to-noise ratio (gCNR) [1] is a measure of contrast between two regions in an image that cannot be artificially improved by dynamic range transformations.
It is computed from the probability density function of pixel intensities in two regions , and as
where is the pixel intensity. In practice the probability density functions are approximated by normalized histograms.
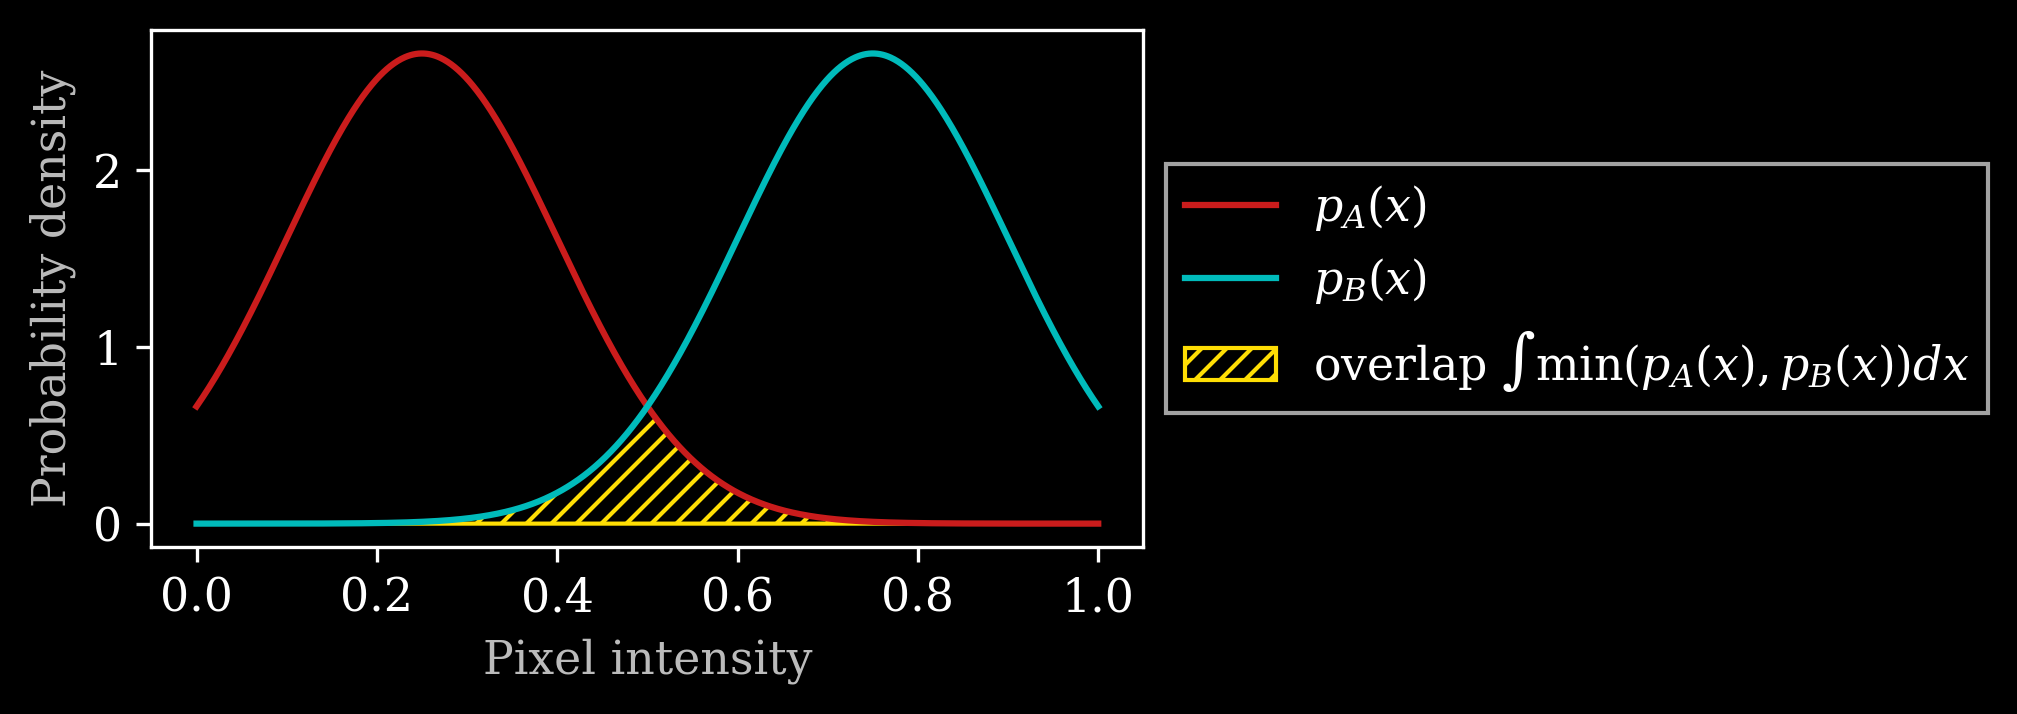
The figure below shows the how the gCNR measures the overlap between and .

The problem with the regular contrast-to-noise ratio
The regular contrast-to-noise ratio is computed as
The problem with this metric is that it can be manipulated by a non-linear dynamic range transformation to artificially increase contrast. The figure below shows an image with two regions and the CNR value computed between the two before and after applying the S-curve in the middle.
We see that the CNR is significantly higher after the S-curve transformation, while the gCNR is unaffected.

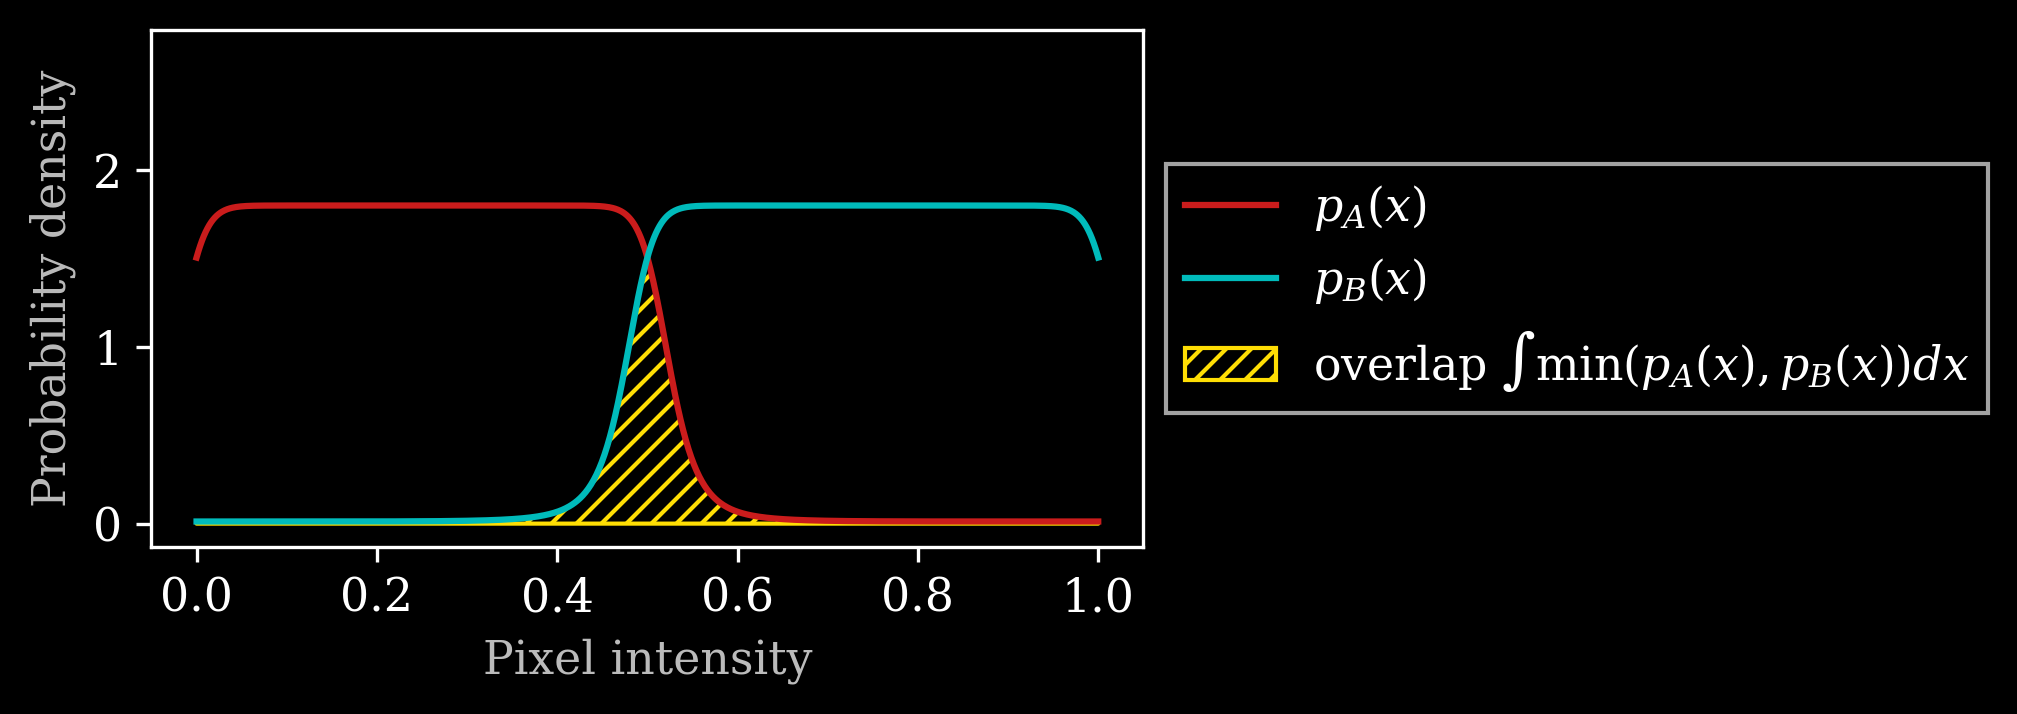
If we look at the probability density functions for the two regions after applying the S-curve we see that although , and have changed a lot, the overlapping area has remained the same.

The code used to generate these plots is available via this link:
[1] A. Rodriguez-Molares et al., “The Generalized Contrast-to-Noise Ratio: A Formal Definition for Lesion Detectability,” IEEE Trans. Ultrason., Ferroelect., Freq. Contr., vol. 67, no. 4, pp. 745–759, Apr. 2020, doi: 10.1109/TUFFC.2019.2956855.